Radon in Pittsburgh by ZIP Code: How Often Basement Tests Come Back High
Type a ZIP code to see how many of its basement radon tests reached EPA's 4 pCi/L action level, from 266,247 Allegheny County tests in Pennsylvania DEP records since 1987. With DEP's advice on retesting and how to check a certified tester or mitigator.
Updated
of the basement radon tests on record in Allegheny County came back at 4 pCi/L or higher, the level at which the EPA recommends fixing a home.
in the three ZIP codes with the highest share, all north of the city: 15090 (Wexford), 15101 (Allison Park) and 15237 (Ross and McCandless).
in 15224 (Bloomfield and Garfield), the lowest share around Pittsburgh. Even there, almost one test in ten came back that high.
Pennsylvania's Department of Environmental Protection keeps the radon test results reported to it, with the ZIP code of each building. For Allegheny County that is 266,247 basement tests from 1987 to October 2026. Type a ZIP code or tap the map to see how often tests there came back high.
Under 15%15 to 24%25 to 34%35 to 44%45% or moreToo few tests
All 78 ZIP codes around Pittsburgh by share of high tests
Many ZIP codes carry Pittsburgh as their postal town, so each one is listed with the neighborhoods or municipalities that cover most of it. The bar is the share of basement tests at 4 pCi/L or more.
| ZIP | Postal town and main areas | Tests | 4 pCi/L or more |
|---|---|---|---|
| 15090 | Wexford · Pine Twp., McCandless Twp. | 13,727 | 46% |
| 15101 | Allison Park · Hampton Twp., McCandless Twp. | 8,341 | 46% |
| 15237 | Pittsburgh · Ross Twp., McCandless Twp., Ohio Twp. | 18,178 | 46% |
| 15116 | Glenshaw · Shaler Twp., Indiana Twp. | 4,389 | 45% |
| 15238 | Pittsburgh · Fox Chapel, Indiana Twp., O'Hara Twp. | 6,647 | 44% |
| 15044 | Gibsonia · West Deer Twp., Richland Twp., Pine Twp. | 10,895 | 44% |
| 15229 | Pittsburgh · Ross Twp., West View | 4,070 | 42% |
| 15143 | Sewickley · Franklin Park, Sewickley Heights | 10,116 | 41% |
| 15209 | Pittsburgh · Shaler Twp., Millvale | 2,569 | 40% |
| 15024 | Cheswick · Indiana Twp., Harmar Twp., West Deer Twp. | 1,684 | 40% |
| 15146 | Monroeville | 6,538 | 39% |
| 15108 | Coraopolis · Moon Twp. | 10,684 | 39% |
| 15025 | Clairton · Jefferson Hills | 2,015 | 37% |
| 15068 | New Kensington · Plum | 526 | 36% |
| 15223 | Pittsburgh · Shaler Twp., Etna | 1,223 | 36% |
| 15214 | Pittsburgh · Perry North, Ross Twp., Perry South | 2,130 | 36% |
| 15135 | McKeesport · Elizabeth Twp. | 566 | 36% |
| 15235 | Pittsburgh · Penn Hills, Churchill | 7,338 | 35% |
| 15057 | Mcdonald · North Fayette Twp., South Fayette Twp. | 675 | 34% |
| 15037 | Elizabeth · Elizabeth Twp., Lincoln | 1,201 | 33% |
| 15104 | Braddock · North Braddock, Rankin | 342 | 33% |
| 15204 | Pittsburgh · Sheraden, Windgap | 817 | 33% |
| 15035 | East McKeesport | 165 | 33% |
| 15239 | Pittsburgh · Plum | 3,969 | 32% |
| 15132 | McKeesport | 1,004 | 32% |
| 15137 | North Versailles · North Versailles Twp. | 1,061 | 32% |
| 15120 | Homestead · Munhall, West Homestead | 2,217 | 32% |
| 15034 | Dravosburg | 111 | 32% |
| 15147 | Verona · Penn Hills, Plum | 2,433 | 32% |
| 15215 | Pittsburgh · O'Hara Twp., Fox Chapel | 3,880 | 31% |
| 15241 | Pittsburgh · Upper St. Clair | 8,379 | 31% |
| 15221 | Pittsburgh · Wilkinsburg, Forest Hills, Braddock Hills | 5,100 | 31% |
| 15131 | McKeesport · White Oak | 1,120 | 30% |
| 15140 | Pitcairn · Monroeville | 229 | 30% |
| 15106 | Carnegie · Collier Twp., Scott Twp. | 3,154 | 30% |
| 15220 | Pittsburgh · Green Tree, Scott Twp., Elliott | 3,158 | 30% |
| 15133 | McKeesport · Liberty, Port Vue, Lincoln | 589 | 29% |
| 15145 | Turtle Creek · Wilkins Twp. | 647 | 29% |
| 15102 | Bethel Park | 7,841 | 29% |
| 15122 | West Mifflin | 3,012 | 29% |
| 15136 | McKees Rocks · Robinson Twp., Kennedy Twp., Stowe Twp. | 3,284 | 29% |
| 15126 | Imperial · Findlay Twp., North Fayette Twp. | 1,710 | 29% |
| 15129 | South Park · South Park Twp. | 2,042 | 28% |
| 15017 | Bridgeville · South Fayette Twp., Collier Twp. | 3,929 | 28% |
| 15217 | Pittsburgh · Squirrel Hill South, Squirrel Hill North | 8,010 | 28% |
| 15071 | Oakdale · North Fayette Twp., Collier Twp., South Fayette Twp. | 1,785 | 28% |
| 15228 | Pittsburgh · Mount Lebanon Twp. | 6,779 | 28% |
| 15205 | Pittsburgh · Robinson Twp. | 3,615 | 27% |
| 15210 | Pittsburgh · Carrick | 2,094 | 27% |
| 15112 | East Pittsburgh · Wilkins Twp., Chalfant | 254 | 27% |
| 15208 | Pittsburgh · Homewood South, Point Breeze, Homewood North | 1,559 | 27% |
| 15234 | Pittsburgh · Castle Shannon, Mount Lebanon Twp., Overbrook | 3,374 | 27% |
| 15236 | Pittsburgh · Baldwin, Pleasant Hills, Whitehall | 6,667 | 27% |
| 15243 | Pittsburgh · Mount Lebanon Twp., Scott Twp. | 4,854 | 27% |
| 15227 | Pittsburgh · Baldwin, Brentwood, Whitehall | 5,435 | 26% |
| 15142 | Presto · Collier Twp. | 599 | 26% |
| 15212 | Pittsburgh · Reserve Twp., Brighton Heights | 3,825 | 25% |
| 15218 | Pittsburgh · Swissvale, Edgewood, Swisshelm Park | 3,807 | 25% |
| 15219 | Pittsburgh · Crawford-Roberts | 529 | 25% |
| 15202 | Pittsburgh · Bellevue, Kilbuck Twp., Avalon | 3,808 | 24% |
| 15207 | Pittsburgh · Hazelwood, Hays, Lincoln Place | 1,625 | 24% |
| 15213 | Pittsburgh · Squirrel Hill South, North Oakland, South Oakland | 1,186 | 23% |
| 15144 | Springdale · Springdale Twp. | 524 | 23% |
| 15211 | Pittsburgh · Mount Washington, Duquesne Heights | 2,010 | 22% |
| 15226 | Pittsburgh · Brookline | 3,044 | 22% |
| 15110 | Duquesne | 164 | 21% |
| 15139 | Oakmont · Plum | 1,359 | 20% |
| 15216 | Pittsburgh · Beechview, Dormont, Mount Lebanon Twp. | 5,238 | 20% |
| 15206 | Pittsburgh · Lincoln-Lemington-Belmar, Highland Park | 4,345 | 19% |
| 15148 | Wilmerding · Wall, North Versailles Twp. | 106 | 19% |
| 15222 | Pittsburgh · Strip District, Central Business District | 167 | 17% |
| 15045 | Glassport | 267 | 17% |
| 15232 | Pittsburgh · Shadyside, Squirrel Hill North | 2,027 | 17% |
| 15201 | Pittsburgh · Central Lawrenceville, Stanton Heights, Upper Lawrenceville | 2,960 | 16% |
| 15233 | Pittsburgh · Marshall-Shadeland, Chateau, Manchester | 335 | 16% |
| 15203 | Pittsburgh · South Side Flats, South Side Slopes | 1,910 | 15% |
| 15049 | Harwick · Springdale Twp. | 126 | 13% |
| 15224 | Pittsburgh · Bloomfield, Garfield | 1,281 | 9% |
When the number on your test is 4 or more
Read it against the EPA line
The EPA's advice is to fix a home with radon at 4 picocuries per liter (pCi/L) or more. Because no level is known to be safe, it also suggests thinking about a fix between 2 and 4.
Test again before you spend
DEP suggests a second test to confirm a result above 4. For a first result between 4 and 8 that can be a long-term test lasting a year or another short-term test of two to seven days. If the second result is still 4 or more, DEP says to have the level brought down.
Hire only a DEP-certified firm
Pennsylvania's Radon Certification Act means anyone who tests for radon in someone else's building, analyzes the samples or installs a reduction system has to be certified by DEP. The department publishes its lists of certified testers and mitigators by county and updates them every month. It also suggests asking to see a current DEP ID card.
Keep checking once a system is in
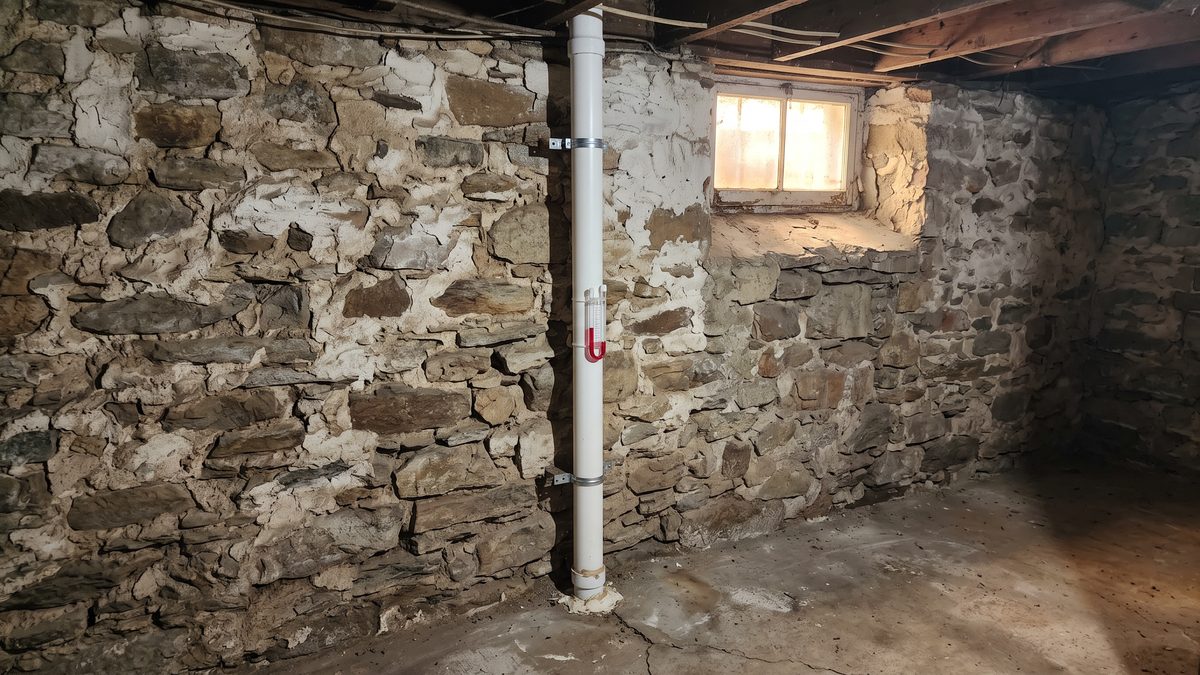
DEP's advice for a home with a fan system is to glance at the U-tube gauge on the pipe from time to time, since even fluid levels can mean the fan has stopped, and to test again every two years, generally in the basement and preferably in the heating season.
A do-it-yourself test kit costs about $20 to $30 at hardware or home improvement stores, according to DEP. It suggests the basement as a good place for the test because levels are often highest there, and the ground floor in a home without one.
Lists for the work that follows a radon result
We do not have a list of radon contractors for Pittsburgh. These lists cover the work on a house that often goes with a radon test, from the inspection before you buy to the basement itself. Before you hire anyone from them for radon work, look their name up on DEP's list.
- Home inspectors
- Basement waterproofing and foundation repair
- Water damage and mold remediation
- Realtors
How the shares were counted
Everything here is our own arithmetic on DEP's records. A share of tests is not a forecast for any one house. Only a test in your own home tells you its level.
- Source: DEP's radon test results for Allegheny County on Pennsylvania's open data portal, from 1987 to October 8, 2026, read on November 14, 2026.
- Only results taken in a basement, in homes or buildings of unknown use. Schools and other buildings are left out. When one test has two results side by side, they are averaged, which gives 266,247 tests.
- Across the county the typical basement test (the median) was 2.7 pCi/L and 10% reached 10 pCi/L or more. Since 2016 the share at 4 or more is 30%, from 103,661 tests.
- The records do not say whether a test was made before or after a reduction system went in, so some tests of homes already fixed are counted. A house tested twice counts twice.
- ZIP code areas are Allegheny County's boundaries, cut at our circle of about 12 miles around Downtown. 18 ZIP codes with fewer than 100 tests in the county records are shaded without a figure. Where the data comes from.